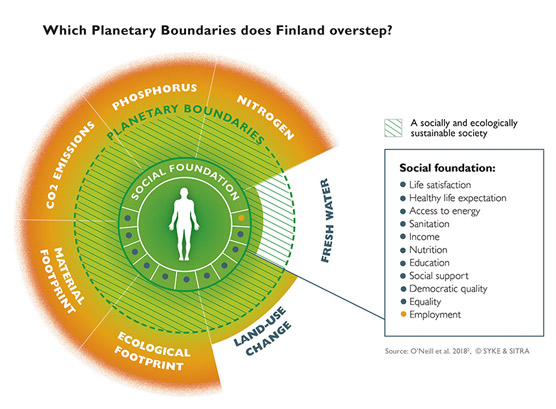
Consumption in Finland has exceeded the level that is globally just and sustainable. With the exception of the use of fresh water, consumption by Finns exceeds all of the biophysical boundaries. According to a study carbon emissions from consumption by Finns were 14.7 tons a year in 2014. This exceeds the limit of 1.6 tons per capita by nearly a factor of ten. The excess is even greater in nitrogen emissions: emissions of nitrogen from Finnish consumption are globally 96.3 kilos per person, while the limit is 8.9 kilos per person a year. High nitrogen emissions can already be seen in eutrophication of the Baltic Sea, for instance.

Picture. Social goals that have been achieved by Finland and how they relate to the limits of the planet. Finland has achieved the social goals in all areas except employment. However, Finnish consumption is not sustainable; the environmental impact of per capita consumption exceeds the fair level. Source: O’Neill et al. 2018. © SYKE & SITRA
Link to the larger file
Finnish sustainable well-being in proportion to biophysical boundaries and social thresholds
|
Biophysical Indicator
|
Finland
|
Per Capita
Boundary
|
Unit
|
| CO2 Emissions |
14.7 |
1.6 |
tonnes CO2 per year |
| Phosphorus |
6.5 |
0.9 |
kilograms P per year |
| Nitrogen |
96.3 |
8.9 |
kilograms N per year |
| Blue Water |
211 |
574 |
cubic metres H2O per year |
| eHANPP |
4.4 |
2.6 |
tonnes C per year |
| Ecological Footprint |
4.8 |
1.7 |
global hectares (gha)
per year |
| Material Footprint |
30.9 |
7.2 |
tonnes per year |
|
Social Indicator
|
Finland
|
Threshould
|
Unit
|
| Life Satisfaction |
7.4 |
6.5 |
[0-10] Cantril scale |
| Healthy Life Expect. |
70.5 |
65 |
years of healthy life |
| Nutrition |
3285 |
2700 |
kilocalories per capita
per day |
| Sanitation |
100 |
95 |
% with access to
improved sanitation |
| Income |
100 |
95 |
% who earn above
$1.90 per day |
| Access to Energy |
100 |
95 |
% with access to
electricity |
| Education |
107.5 |
95 |
% enrolment in
secondary school |
| Social Support |
93.8 |
90 |
% with friends or family
they can depend on |
| Democratic Quality |
1.5 |
0.8 |
Democratic Quality Index |
| Equality |
74.2 |
70 |
[0-100] Scale ->
(1 - Gini Index) * 100 |
| Employment |
92.3 |
94 |
% of labour force
employed |
(Source O'Neill et. al. 2018)
Long life expectancy, a high level of education, and high life satisfaction have been achieved through comprehensive social policy and economic growth. The Nordic welfare state is often seen as a success story for how well-being is shared in an equitable manner. However, the other side of the coin is a high level of consumption of natural resources and energy. When welfare policies are not on an ecologically sustainable basis, the foundation of well-being and the economy is endangered.